Climate Model
Evaluation
Evaluate CMIP6 models against IMD observations, attribute rainfall signals to GHG and aerosol forcing agents, and project future monsoon precipitation under SSP emissions scenarios.
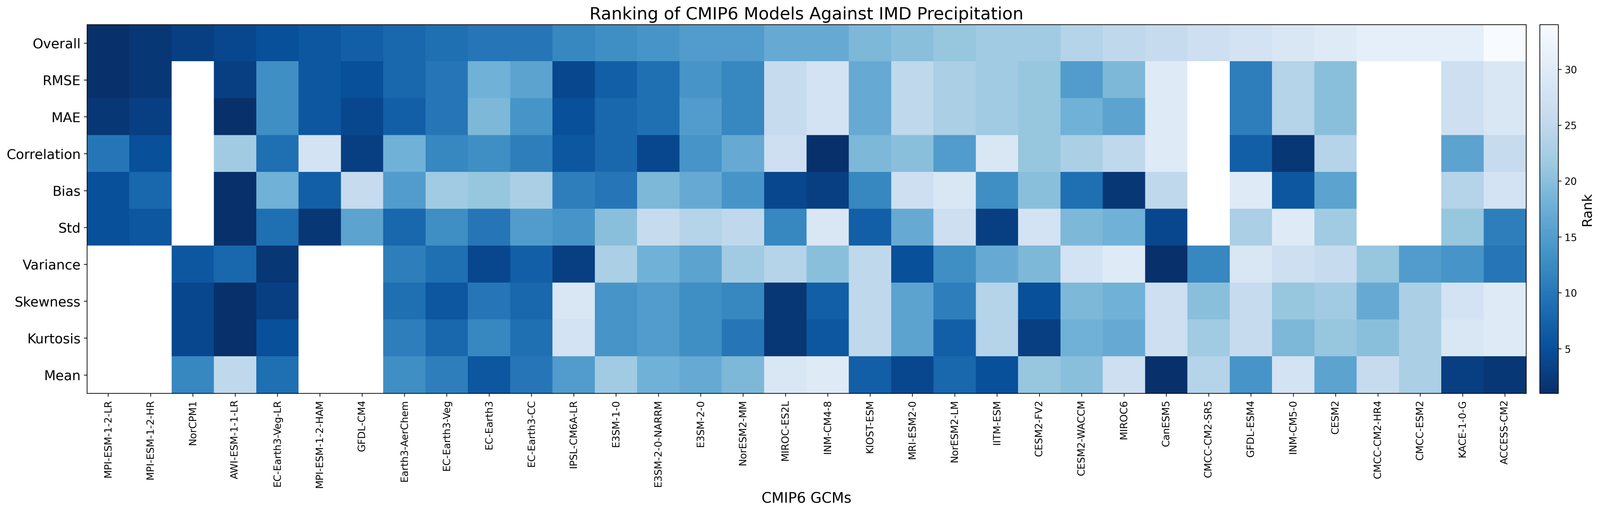
Ranking of CMIP6 models against IMD precipitation · multi-metric skill comparison
Three ways to read the same CMIP6 archive.
Scroll to move through the workflow: first analyze how individual forcing agents shape simulated rainfall, then evaluate each model's overall skill against IMD observations on a Taylor diagram, and finally project how the monsoon may change under different SSP emissions futures.
Analyze forcing signals
GHG forcing traps outgoing radiation and warms the atmosphere; aerosol forcing scatters incoming sunlight back to space. Running CMIP6 models under each forcing alone, and comparing the resulting rainfall trend (green) to IMD observations, is how individual contributions are attributed.
There are different external influences applied to climate models under which precipitation might change — these are called forcings. These influences can be disentangled using climate models to observe the effect of each factor. Two of the largest contributors to climate change and monsoon variability are greenhouse gases and aerosols.
Simulations include only the effect of long-lived greenhouse gases that trap outgoing radiation and warm the atmosphere.
Simulations include only tiny airborne particles that scatter and absorb solar radiation, influencing cloud formation and surface temperatures.
Includes the combined effect of all anthropogenic and natural forcing agents over the historical period.
References
Coupled Model Intercomparison Project Phase 6 (CMIP6) gridded dataset https://aims2.llnl.gov/
Evaluate with IMD
Each dot is one model. Angle encodes correlation with IMD rainfall, radial distance encodes normalised standard deviation, and proximity to the OBS point encodes overall skill — the closer a model sits to that reference, the better it reproduces observed monsoon rainfall.
The Taylor diagram provides a concise statistical summary of how well CMIP6 models reproduce observed rainfall patterns by combining correlation, normalised standard deviation, and centred RMSD in a single plot. In the precipitation section, IMD gridded rainfall is used as the reference dataset. The distance from the origin represents the normalised standard deviation, while the angle indicates the correlation with the IMD data. Models closest to the reference point show the best overall agreement with observations.
References
Coupled Model Intercomparison Project Phase 6 (CMIP6) gridded dataset https://aims2.llnl.gov/
Project 2015–2100
Historical simulations (grey) converge to a single observed record; after 2015 the ensemble fans out by scenario — higher-emission pathways like SSP5-8.5 project a larger, more uncertain shift in monsoon rainfall than SSP1-2.6.
Shared Socioeconomic Pathways (SSPs) are future scenarios that combine human society's development trajectories with greenhouse gas emissions and their impact on climate change. For climate variables like rainfall we refer to SSP1-2.6, SSP2-4.5, or SSP5-8.5 — they indicate different levels of greenhouse gas concentrations and their projected effect on rainfall.
References
Coupled Model Intercomparison Project Phase 6 (CMIP6) gridded dataset https://aims2.llnl.gov/