Rainfall
Analysis
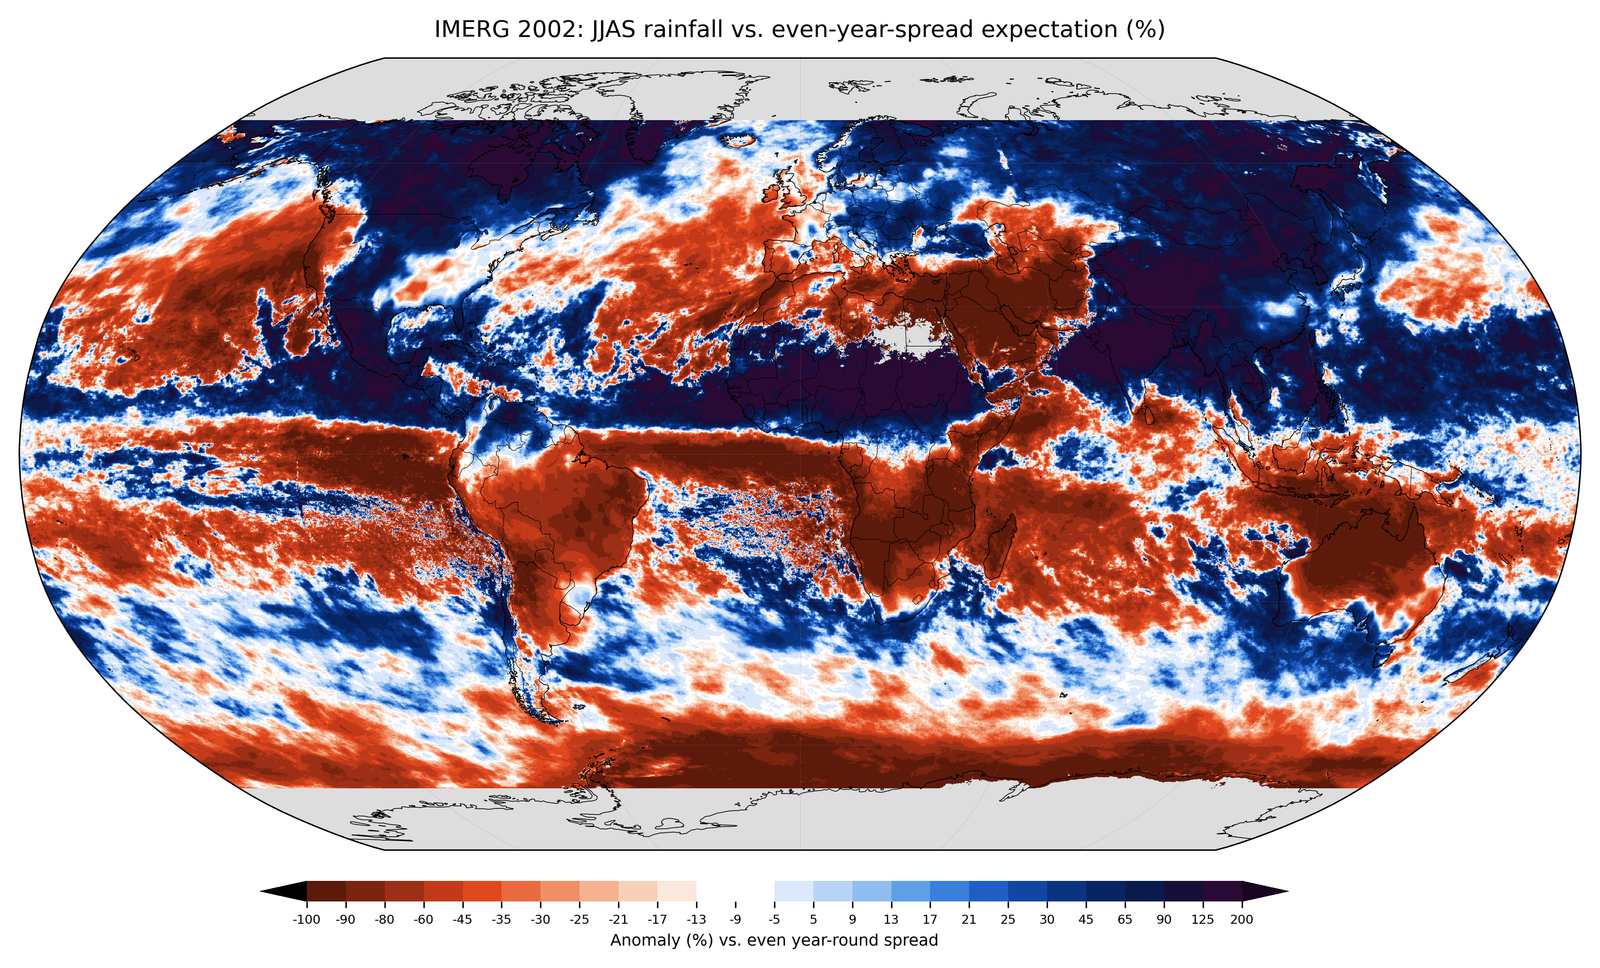
JJAS 2002 precipitation anomaly · IMERG gridded rainfall dataset
JJAS 2002 precipitation anomaly · IMERG gridded rainfall dataset
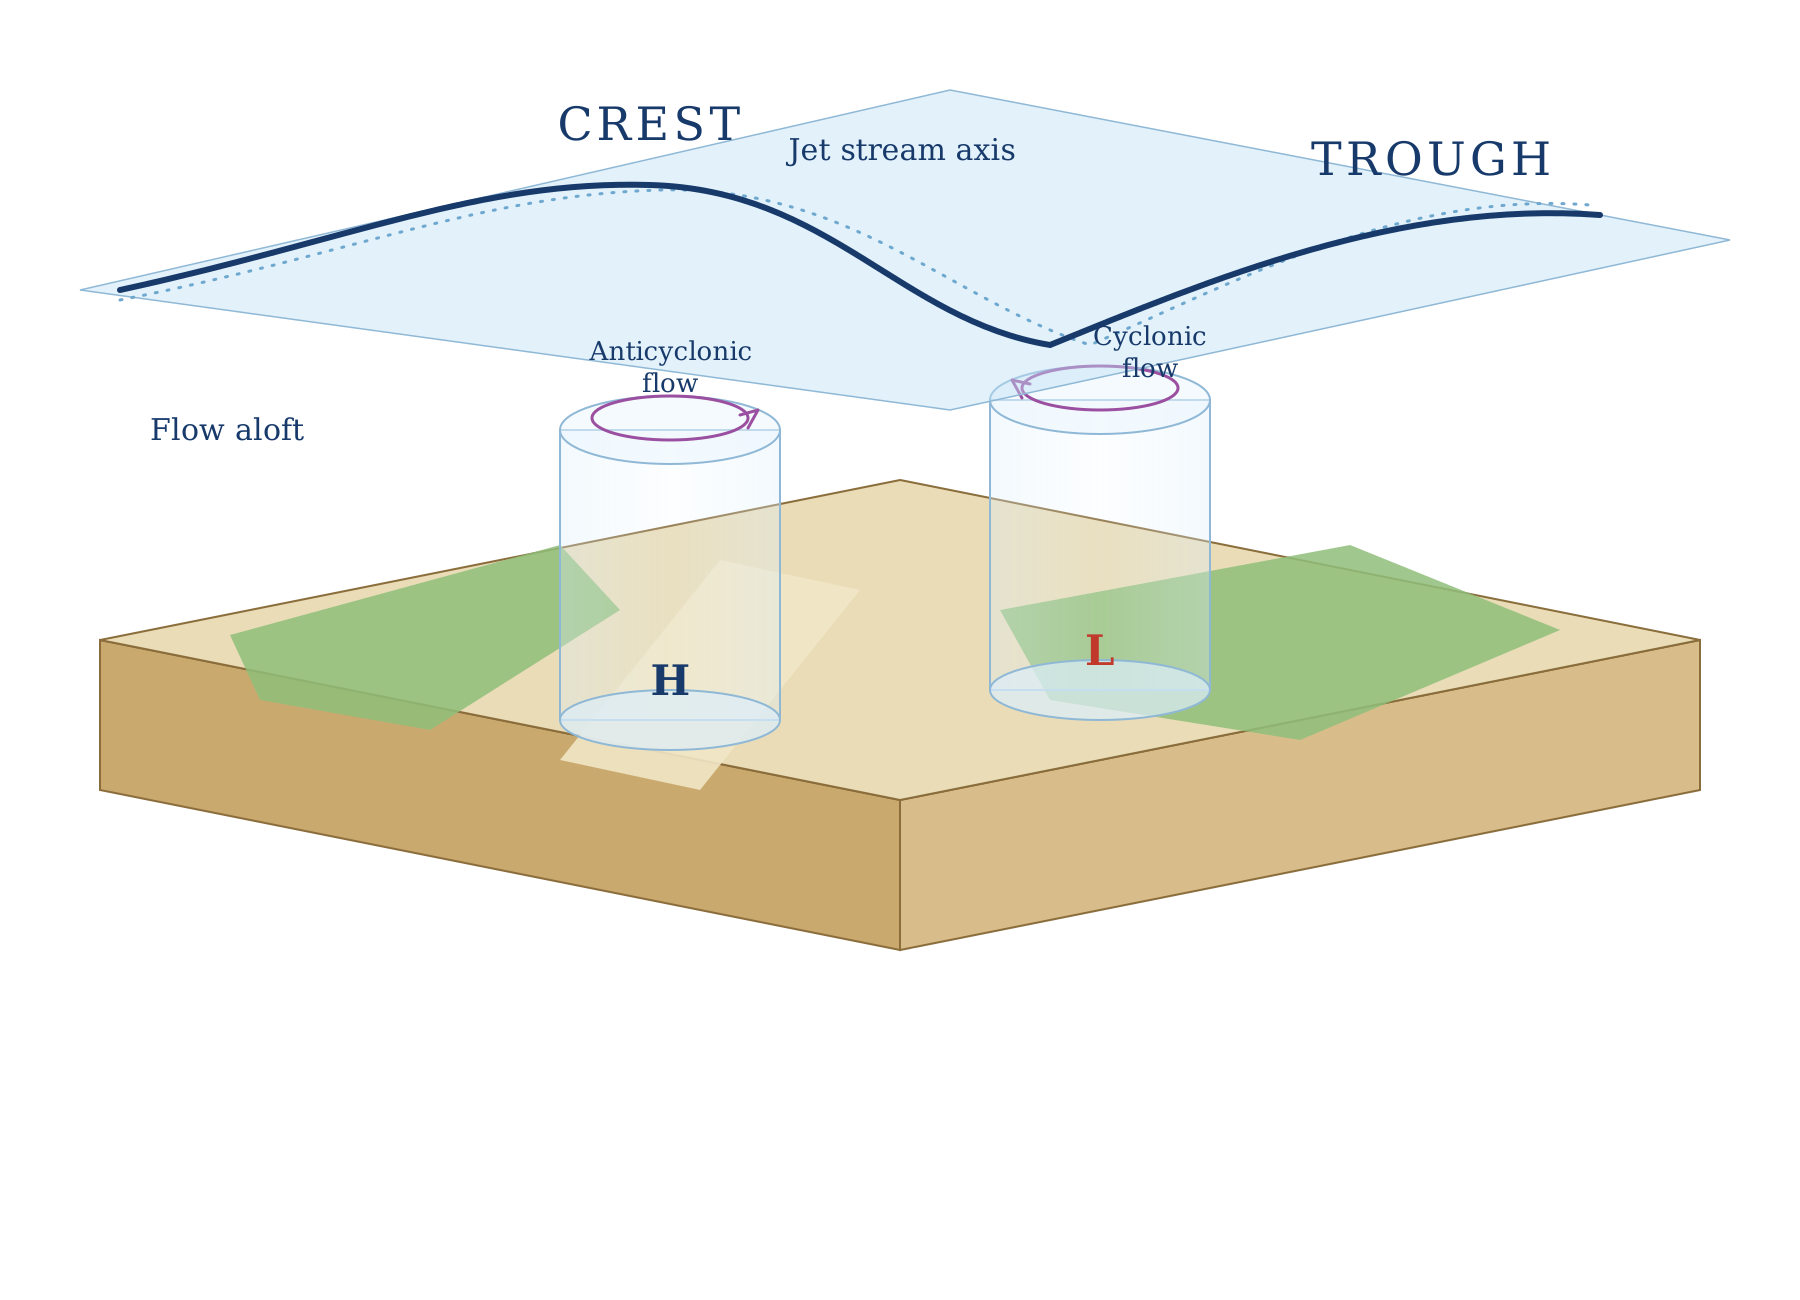
NW India and Tibet heat up intensely, but the sub-tropical jet stream's ridge still sits overhead, trapping the heat below it. Result: hot and dry, March–May.
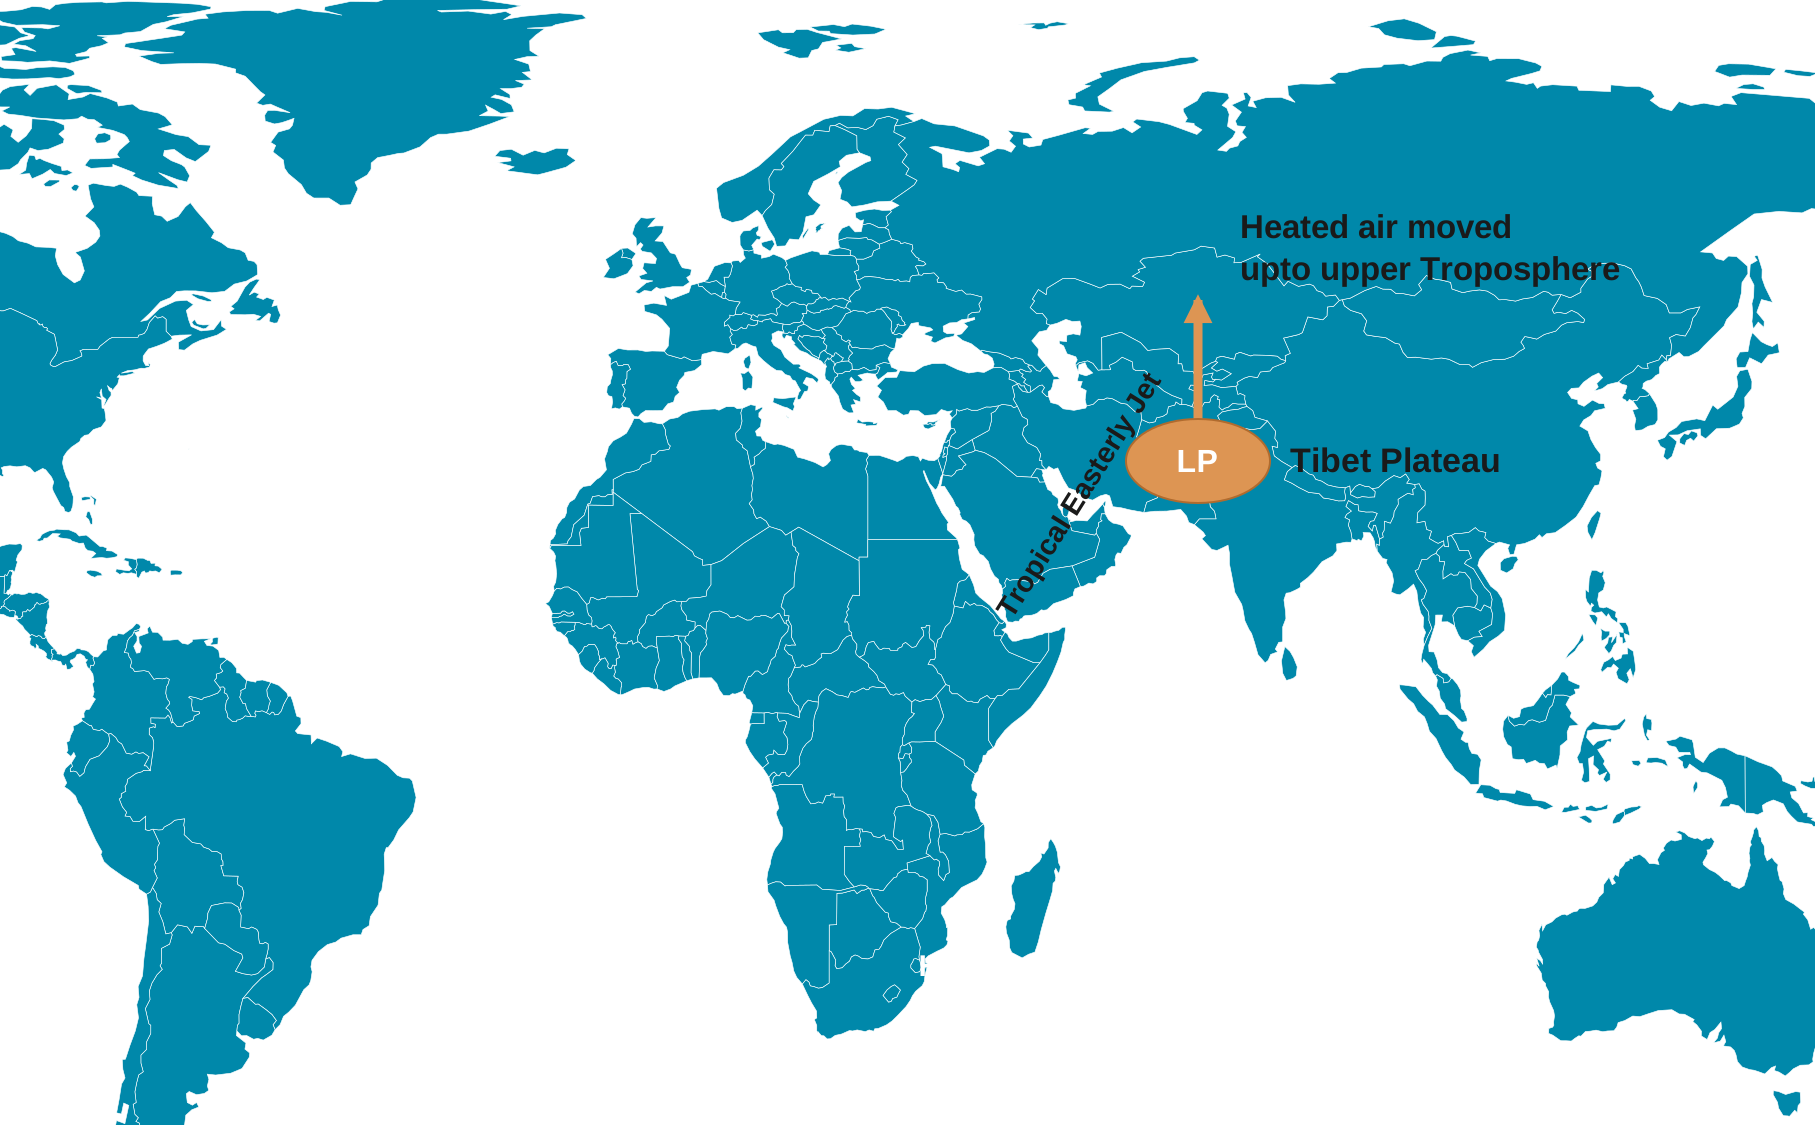
In late May the jet stream suddenly shifts north of the Tibetan Plateau, removing the cap and triggering the monsoon's abrupt onset. This also allows the Tropical Easterly Jet (TEJ) to form over peninsular India, reversing the upper-air circulation.
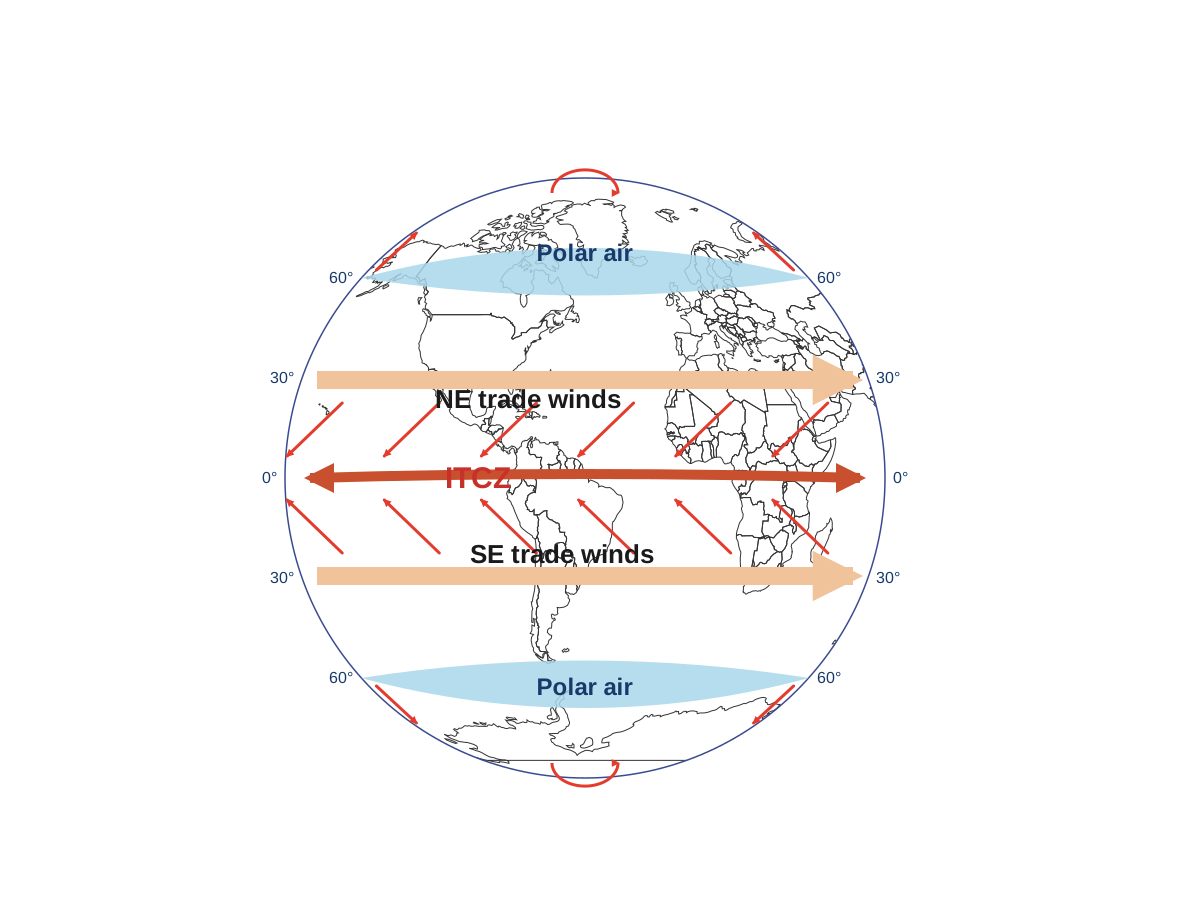
With the upper-air circulation reversed, the ITCZ shifts north to 20–25°N in July, settling over the Indo-Gangetic Plain as the Monsoon Trough — the axis of maximum rainfall, fed by the Arabian Sea and Bay of Bengal branches.
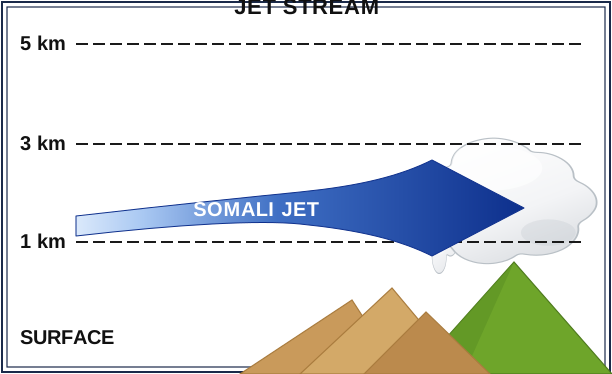
A fast low-level jet off the coast of Somalia accelerates moist air across the Arabian Sea, feeding the Arabian Sea branch of the monsoon into the trough with even greater force.

The Arabian Sea and Bay of Bengal branches feed the trough continuously through June–September, sustaining India's main rainy season — with year-to-year strength shaped by how intensely the Tibetan Plateau heated up and the phase of the Indian Ocean Dipole.
Regionally, the Western Ghats and Northeast India gets the heaviest monsoon rainfall. For each district below, the map shows the average rainfall it typically recieves, along with by how much the rainfall has been changing over time.
Selected District
Select a district on the map to reveal rainfall indicators.
Trend
—
Variability
—
Ground based gridded observational rainfall data is difficult to measure at very fine spatial scales than the assimilated or satellite data. The IMD one-degree resolution, long-term observational data for India is available, with this we explore different aspects of the monsoon, such as dry-day counts, the spatial extent of extreme rainfall, and mean rainfall by state, over a much longer period. These variables also help characterise the monsoon's active and break spells, onset or withdrawal variability.
State Statistics
Data unavailable is currently under review
Trend Summary
Monsoon rainfall across India shows a declining trend over the past 70 years, with increased variability in recent decades.
India Meteorological Department (IMD). Gridded Daily Rainfall Dataset (1901–2020). https://imdpune.gov.in
Rajeevan, M. and Pattanaik, D.R., 2023. Evolution of monitoring and forecasting of southwest monsoon. MAUSAM,
Gadgil, S., 2003. The Indian Monsoon and Its Variability. Annual Review of Earth and Planetary Sciences, 31, pp.429–467.